




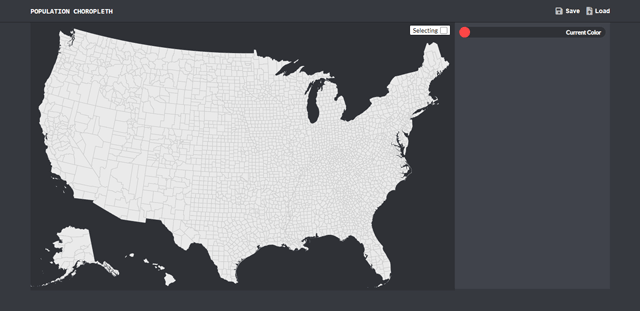
Interactive Map
The main page of the app features an interactive map of all US counties, which the user can pan around and zoom in and out of.
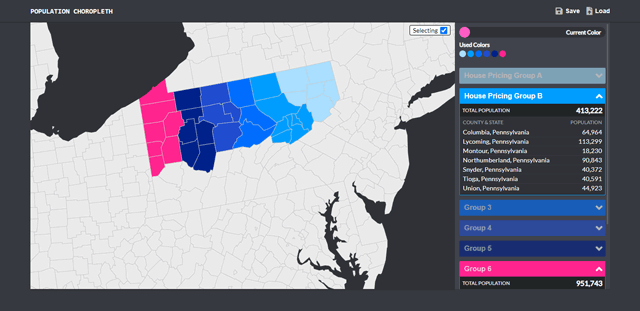
Color-Coded Selections
When the 'Selecting' checkbox at the top is on, the user can click on counties to select them. Each selected county is placed inside a group with counties that were marked with the same color. These groupings appear on the sidebar, to the right of the map, and feature populations for each county, as well as the total population for the group. Each group can also be assigned a custom name. To create a new group or return to a previously applied color, the user can choose from the color picker options at the top of the sidebar.
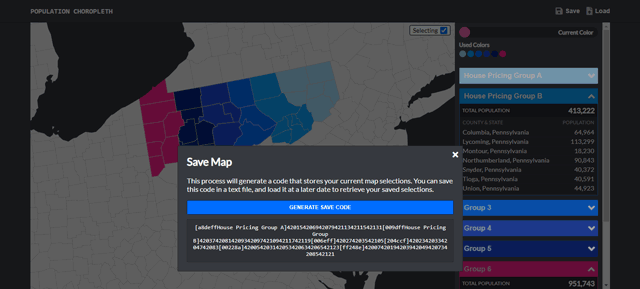
Saving Maps
The option in the top-right corner of the navbar opens a modal, which can be used to save the current map. As the app isn't running a database, the save function works by generating a shortcode, which represents all current selections. The user can then save this code on their computer - in a text file, for example.
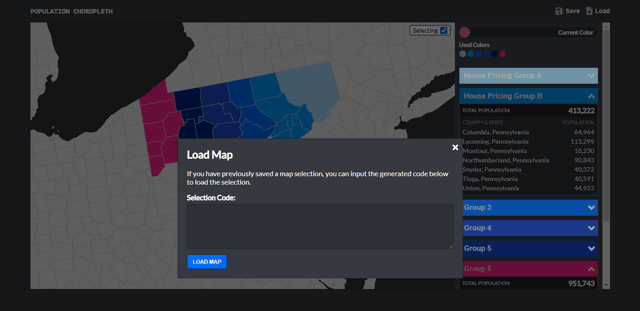
Loading Maps
Another option in the top-right corner of the navbar open the load modal, where a user can input a previously-saved shortcode to re-generate an older map.